E-Commerce-sales-dashboard
Ecommerce Sales Dashboard using Power BI
Overview
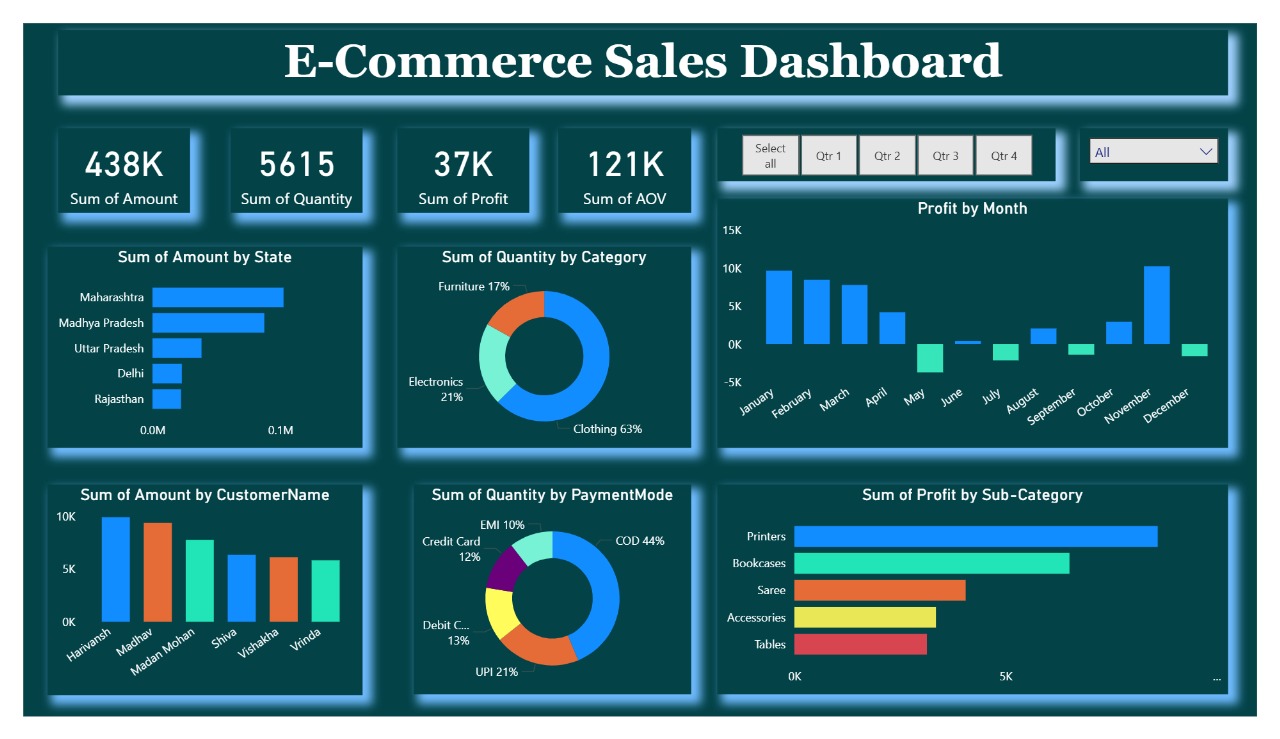
The E-commerce Sales Dashboard project provides comprehensive insights into e-commerce sales performance through interactive and visually appealing dashboards developed in Power BI. The dashboard focuses on analyzing and monitoring key metrics such as:
- Profit
- Order Volume
- Customer Demographics
- Product Performance
- Sales Trends
By leveraging data from the e-commerce platform, the dashboard enables stakeholders to make data-driven decisions, identify growth opportunities, and track the effectiveness of marketing campaigns.
Features
- Interactive dashboard to track and analyze online sales data
- Drill-down capabilities using complex parameters, filters, and slicers
- Data connections, table joins, and calculations for user-driven visualizations
- Multiple customized visualizations: bar chart, pie chart, donut chart, clustered bar chart, scatter chart, line chart, area chart, map, slicers, and more
Dashboard Preview